Disk based systems have gone from
5000 RPM and 30 or less megabytes to 15K RPM and terabytes in size in the last
30 years. The first Winchester technology drive I came in contact with in the
early 1980’s had a 90 megabyte capacity (9 times the capacity that the 12 inch
platters that I was used to had) and was rack mounted, since it weighed over 400
pounds! Now we have 3 terabyte drives in a 3-1/2 inch form factor. However as
information density increased, the bandwidth of information transfer didn’t
keep up at the hard drive level. Most modern disk drives can only accomplish 2
to 3 times the transfer rate of their early predecessors, why is this?
1. The number of independent heads
2. The speed of the disk actuator mechanism
3. The speed of the disks rotation
While most disks have multiple
platters and multiple read/write heads, the read/write heads are mounted to a
single actuator mechanism. By mounting the heads on a single actuator mechanism
you may increase the amount of data capable of being read/written at the same
time, but you do not increase the maximum random IOPS. Because of these
physical limitations most hard drives can only deliver 2-5 millisecond latency
and 200-300 random IOPS.

Figure 1: HDD Armature and Disks
Modern SAN and NAS system are
capable of delivering hundreds of thousands of IOPS, however, you must provide
enough disk spindles in the array to allow this. To get 100,000 IOPS assuming
300 IOPS per disk you would need 334 disk drives at a minimum, more if you want
to serve that 100,000 IOPS to multiple servers and users. In an EMC test, they
needed 496 drives to get to 100,000 IOPS. Of course, the IOPS latency would
still be from 2-5 milliseconds or greater. The only way to reduce latency to
nearer to the 2 millisecond level is to do what is known as short-stroking.
Short stroking means only
utilizing the outer, faster, edges of the disk, in fact usually less than 30%
of the total disk capacity. That 496 disks for 100,000 IOPS at 5 milliseconds
just became 1488 or more to give 100,000 IOPS at 2 millisecond latency.
Disks have fallen dramatically in
cost per gigabyte. However their cost
per IOPS has remained the same or risen. The major cost factors in a disk
construction are the disk motor/actuator and technology to create the high
density disks. This means that as disk technology ages, without major
enhancements to the technology, their price will eventually stall at around 10
times the cost of the raw materials to manufacture them.

Figure 2: Disk Cost Per GB RAW
So where does all this leave us?
SSD technology is the new kid on the block (well, actually they have been
around since the first memory chips) now that costs have fallen to the point
where SSD storage using Flash technology is nearly on par with enterprise disk
costs with SSD cost per gigabyte falling below $40/gb. A recent EMC
representative presentation quoted $17K/TB of storage.
SSD technology using Flash memory
utilizing SLC based chips provides reliable, permanent, and relatively
inexpensive storage alternatives to traditional hard drives. Since each SSD
doesn’t require its own motor, actuator and spinning disks, their prices will
continue to fall as manufacturing technology and supply-and-demand allows. Current
prices for a fully loaded 24 TB SSD using eMLC technology sit at around
$12K/TB, less than for enterprise level HDD based SAN. This leads to a closing
of the gap between HDD and SDD usage modes as shown in Figure 3.
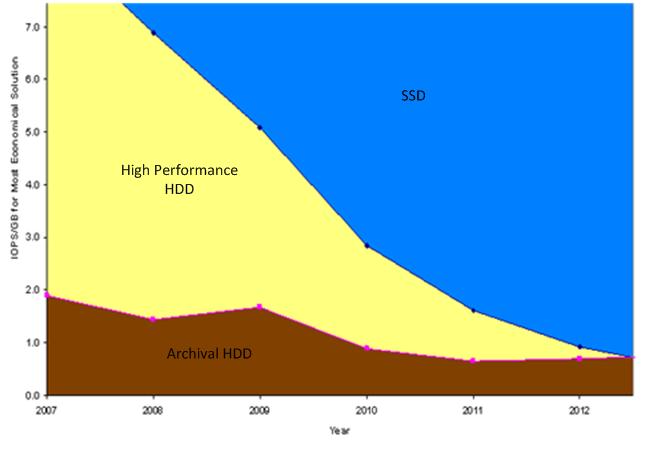
Figure 3: Usage Mode Changes for HDD
and SSD
In addition to price to purchase,
operational costs (electric, cooling) for SSD technology is lower than the
costs for hard disk based technology. Combine that with the smaller footprint per
usable capacity and you have a combination that sounds a death knoll for disk
in the high performance end of the storage spectrum. Now that SSDs are less
expensive then enterprise level disks at dollars (or Euros) per terabyte and when
a single 1-U chassis full of SSDs can replace over 1000 disks and costs are
nearing parity, it doesn’t take a genius to see that SSDs will be taking over
storage.

Figure 4: Comparison of IOPS verses
Latency
A SSDs full capacity can be used
for storage, there is no need to “short-stroke” them for performance. This
means that rather than buying 100 terabytes to get 33 terabytes you buy 33
terabytes. SSDs also deliver this storage capacity with IOPS numbers of 200,000
or greater and latencies of less then 0.5 milliseconds. With the various SSD
options available the needed IO characteristics for any system can be met as is
shown in Figure 5.

Figure 5: Response and IOPS for
Various SSD Solutions
These facts are leading to tiering
of storage solutions with high performance SSDs at the peak, or tier zero, and
disks at the bottom as archival devices or for storage of non-critical data.
Rest in peace disk drives.

No comments:
Post a Comment