Monday, March 12, 2012

Flash on Flash

Why exactly did Oracle create the Flash Cache concept? Well, generally speaking flash is going to be faster than disk for access of data, so, putting a bit of flash into your server and then using it as an L2 cache for the database cache makes sense. In this test we aren’t dealing with the Exadata Cell based flash cache, but the DB, server based flash cache.

But what happens when disk isn’t the storage media? Let’s look at a flash-on-flash test case using a RamSan630 flash solid state storage appliance and a RamSan 70 PCIe server mounted flash card.


Figure 1: Test Configuration

The flash cache was sized at the lower end of the suggested 2X to 10X the database cache size (90 gb) and then a run with the flash cache set to zero was run. Note that for the first run appropriate tables and indexes were assigned to be kept in the flash cache, other tables where set to default. Figure 2 shows the results from use of the Smart Flash Cache with Flash as storage.


Figure 2: TPS verses GB in the Flash cache

At least for our testing with the database on a RamSan630 SSD and the flash cache being placed on a RamSan70 PCIe card, the results are not encouraging towards the use of the flash cache with a flash based SAN. Review of the AWR results showed that the flash cache was indeed being used but, due to the small difference in overall latency between the RS630 with IB interfaces and the RS70 in the PCIe slot, the overall effect of the flash cache was negligible. According to AWR results when the flash cache was set to zero the predominate wait event was the db file sequential read, when the flash cache was set to 90 gb, the db flash cache single block physical read event dominated the report, thus showing that the cache was in fact being used.

These results demonstrate that for a database system that is based on high-speed flash storage, the DB flash cache will not be needed.

Wednesday, November 17, 2010

DOAG in Nuremberg

Well here it is Thursday in Nuremberg Germany. On Tuesday I gave my presentation "Validating your IO Subsystem - Coming Out of the Black Box" to a packed room (about 100 attendees). Nobody threw anything, I didn't see anyone sleeping and other than right at the end, no one walked out and everyone clapped at the end, so I guess it was successful!

I have seen Steve Feuerstein, Tom Kyte, Danial Morgan and several other big names in the industry here (as well as myself I guess!)

The booth traffic has been moderate to light with a few folks stopping in for extended chats. There seems to be a lot of interest in SSDs and we still need to correct misinformation and bad data about SSDs.

Nuremberg (at least Alt Nuremberg, the walled inner city) is wonderful, of course after our arrival on Sunday it has been raining which has limited sight-seeing (working from 7am to 5pm also puts a crimp in that) but usually we have been walking from the hotel into Old Town for dinner.

The DOAG conference is the largest in Germany and well worth the effort so far. If you are here and haven't stopped by, please do so!

Wednesday, October 13, 2010

News from VOUG 2010

Here in Richmond I am attending the VOUG 20101 conference. Rich Niemiec did the Keynote Address on “How Oracle came to Rule the Database World”, as usual Rich gave a great presentation. Wev’ve had good booth traffic and some interested folks asking great questions.

In my first presentation, “Detailed AWR Analysis” I had a full room (about 30-40 folks) and lots of good questions. Overall there are about 150 attendees, essentially on par with last year, which is saying a lot with this economy! My second presentation (a vendor presentation), “Testing to Destruction: Part 2” was also well attended with 20-30 attendees with loads of questions and positive comments.

Due to a scheduling SNAFU I am the only TMS person today so I am doing the booth/table as well as my presentations so it doesn’t leave a lot of time to attend other presentations, hopefully tomorrow I will be able to report on some other folk’s papers.

Tuesday, September 21, 2010

OOW 2010

Well here is another Oracle Open World. This year so far has seen the announcement of Oracle's entry into the cloud with the ExaLogic server offering and some news about Exadata being available on Linux. Closer to home, we are seeing good traffic to the booth and getting many good leads.

My first presentation, "Testing to Destruction: Part II" about using TPC-C and TPC-H synthetic workloads for system evaluation and testing was well attended and many folks asked for copies of the Part I on testing using self generated workloads.

On Thursday I give "Using Preferred Read Groups and Oracle ASM" at 3-4pm in room 302 in the South Moscone center.

We have been giving three different presentations in the booth, "TCO: EMC -vs- RamSan630", "OPERA: Oracle Performance Enhancing RamSan Architecture" and "RamSan: The Best Value" Come on by!

Mike

Thursday, August 5, 2010

Why Solid State Devices will Replace Spinning Disks

By Mike Ault

I read with great interest a blog by Mr. Henry Newman entitled “Why Solid State Drives Won’t Replace Spinning Disks” where Mr. Newman extemporized on why he felt SSDs wouldn’t replace HDDs. His major argument seemed to be that SSD technology couldn’t increase capacity fast enough to met increasing capacity needs due to limits in the lithography process even when X-ray and other new lithography techniques are applied to the problem. If that was the only technology for building flash in play I might have to agree with him, however, new advances in nano-technology and carbon instead of silicon will probably usurp the traditional lithography processes well before we need to push past the 11 nm barrier that Mr. Newman projects for the year 2022. Some of the promises of the new carbon based technology are for sugar cube size memory arrays that hold multiple terabytes of memory capacity. Even if the technology only delivers half of what it promises, it will still beat traditional disk based technology by several orders of magnitude. You can read more about this technology here.

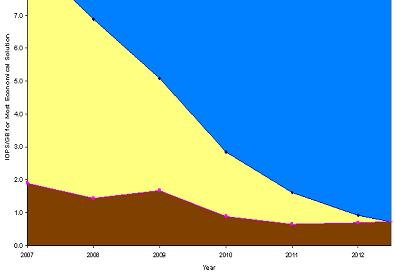
As the need for flash increases, the costs will come down. Already we see that enterprise level flash at less than $40/gb is on par with enterprise level disk, once you add in the needed infrastructure and software costs to maintain that enterprise level disk. As prices drop SSD will encroach further and further on standard HDD territory as is shown in the following graph.


In the graph, blue is the increasing market area that SSDs will dominate, yellow is high performance HDD (15K rpm enterprise level) and brown is for low performance HDD. Essentially by 2013 there will be no high performance HDD except in legacy systems. Shortly after that due to green considerations and the perceived benefits or reduced floor space, better performance and the green technological aspects, SSD will take over from archive storage as well.

Mr. Newman states that the only reason disks have replaced tape was that deduplication made disks more competitive. Well, advanced compression and deduplication algorithms work just as well if not better on SSDs as they do on HDDs so they will accelerate the move from HDD to SSD technology, just as they accelerated the move to HDD from tape.

I find some of the numbers that Mr. Newman quotes to be suspect, for example he states that transferring 8mb on a SATA HDD will take 150 milliseconds, while a SATA SSD could only do it in 100 milliseconds. Since most HDD offer 5.5 millisecond IO and, using Intel 2.5 inch form factor 160 gb SSD drive data, SSDs offer .065-.085 millisecond read/write speeds assuming he means 8,388,608 bytes and you have a transfer size of 8k that would be 5 seconds (or so) of transfer time for the HDD even at 32kb it would take 256 IOs for a time of 1.4 seconds, assuming random, not linear reads since most PCs do lazy writes putting stuff back on disk in the first place they find available. Now, the SSD with its worst case latency of .085 milliseconds could do the deed in 87.4 milliseconds for 8kb reads and 21.8 milliseconds for the 32 kb IO size. Not the 100 and 150 milliseconds stated in the blog. This is a factor of 64 not 0.50 as stated. Of course real world results will differ.

Looking at some real world tests taken from the Intel site where they tested a typical 5400 2.5 inch SATA based laptop to an identical laptop, other were the HDD was replaced with the 2.5 inch form factor Intel SSD, we see a little better what to expect:

PCMark: the SSD was 9x faster
MS Office Install: 40% faster
Blizzard WOW along with 8 running MS Defenders: 2x faster
MS Outlook Export 2007: 2x faster
Virus scan: 40% faster
SYSMark: 16% faster

Even if performance wasn’t an overriding reason for replacing HDD with flash, it would still happen. To get the best performance from HDD you have to stripe it and do what is called short-stroking. This removes 2/3 of your capacity and still only gives you 2-5 ms latency. So, even if flash only gave 2.5 ms latency, the fact that 100% of the SSD capacity is available at full performance is a telling point for SSDs over HDDs. In addition, HDD can only do one operation at a time for one person at a time. Most SSDs can do 32 or more simultaneous operations without conflicts, another major point. Finally, even at the 2.5 form factor level, a HDD uses 0.85 watts at idle and 2.5 watts running full out. An SSD uses .075 watts at idle and only .150 watts at full out. I am sorry Mr. Newman, this will extend battery life for a laptop using an SSD verses an HDD. Another telling blow to HDDs is the SSDs low latency allowing a single device not only to have anywhere from 8,600 up to 35,000 IOPS depending on the read/write ratios but to be able to serve multiple processes while doing it.

Now some of you may be asking why I am quoting the Intel site rather than using numbers from the RamSan series of SSDs from the TMS Inc. site, well, to be honest, we don’t do 2.5 inch form factor or any other form factor drives, so to provide a fair comparison for Mr. Newman’s statements I had to go to a vendor that does provide SSDs at other form factors. Since his arguments seem to be consumer electronics based, I felt I should stay in that domain.

So, to summarize, SDD technology is superior in just about every way other than storage capacity to the HDD drives. That capacity edge for the HDD is being eaten away and may disappear completely with new technologies not using lithography as their basis. As costs decline, there will be fewer reasons to use HDD in anything but archival storage. As the need for HDD decreases its costs and availability will also decline, essentially ending it as a storage media. In the short term hybrid drives combining flash and HDD may be of some use, but eventually they will go the way of bubble memory as well. Mr. Newman, I am afraid the fat lady is singing for HDD technology, can you hear her?

Wednesday, July 21, 2010

Every Cloud Has a Silver Lining

By Mike Ault

One of the big buzz words today is cloud. Server Cloud, Memory Cloud, Storage Cloud, Public Cloud, Private Cloud, clouds ad nauseum, we hear of a new “cloud” implementation almost on a daily basis. But what exactly is a cloud in computer context?

A cloud is a way to present a particular computer resource such that that resource appears to be infinite to the user. For example, company X launches a new website and expects to use 10 servers and 1 terabyte of storage with 100 mb/s bandwidth. Instead, they find they need 100 servers, 10 terabytes and 1000 mb/s due to the unprecedented need for their cell phone antenna amplifier. In the not-so-long-ago days, this could have been a disaster as they ordered new servers, more storage and got more bandwidth and weeks later, they were able to meet a demand no longer present due to the hurried release of the next generation of phone. Enter the era of the cloud: as their monitoring staff notices the huge leaps in access and resource requirements they notify their cloud provider and within a few minutes (not days or weeks) new servers, storage and bandwidth are magically added to their application, keeping things running smooth with no apparent issues to the users, this is how the cloud concept is supposed to work. Unfortunately, the cloud rarely works that way for huge increases in need.

The challenge is that the cloud providers have to be able to scale out and up to meet the needs of all their subscribers. This means being over provisioned in all areas to allow for sudden peaks and needs. Recent papers show how these need spikes can result in under-capacity issues for cloud providers which result in loss of clients, revenue and of course negative publicity. Other issues include perceived security issues with many potential users stating that they would never put their sensitive corporate data “in the cloud.”

All the issues and potential issues aside, one area that really causes problems is the provisioning of storage resources. Unlike CPU resources which can be easily allocated and deallocated at will using virtual machine technology as loads change, static data needs only increase for the users in the cloud space, requiring larger and larger numbers of storage arrays. In addition to capacity as volume, capacity as related to IOPS and latency are also an issue to meet required service level agreements (SLA). Providers find they must use many times the number of disks for storage capacity to satisfy SLA requirements, leaving excess capacity storage-volume wise unused.

One solution for the storage capacity versus SLA dilemma in the cloud space is to utilize a tiered performance based storage cloud for use by the users of the overall cloud space. Utilizing fast SSD storage in the uppermost tiers allow maximum use of resources as SSDs are not sensitive to data placement and there is no need to short-stroke them to get low latency access. Thus clients with stringent SLA requirements are placed into the SSD portion of the cloud while those without as strict a requirement are relegated to standard disk based storage. By removing the need for low latency response from the disks, the disks can be more fully utilized so rather than only provisioning at 20% of capacity per disk drive, they a now be provisioned at 60% or higher, allowing 1/3 the number of disks to be required.

By using SSD technology for low latency customers greater overall storage efficiency is realized as SSDs can be used at 100% of storage capacity and by removing the need for low latency reads from lower tier disk assets, the disks can also be utilized at a much higher capacity. For example, if an application requires 1-2 ms latency to meet response time requirements for their applications, you would need to have a read-caching SAN with disks short-stroked to 20% of capacity. This would mean at a minimum, buying 5 times the number of needed drives to meet this performance requirement. So a 7 TB database would require, at a minimum 35 TB of disks with no protection, up to 70 disks depending on the type of RAID utilized. Alternatively, if the application data is hosted on a tier 0 SSD system such as a RamSan-630 which has 10 TB of storage, only one or two (for redundancy) SSDs are required for a large reduction in server room footprint, energy and cooling requirements.

In the server cloud space, SSDs can also make a huge difference. The largest use of resources for the cloud is the instantiation of the virtual machine spaces used to serve clients. In tests using a standard SAN, only 10-15 VMs were able to instantiated simultaneously. When a SSD was substituted for the SAN, 40-50 VMs could be instantiated in the same time frame with much lower taxing of other resources. You can read more about this SSD implementation here: http://vknowledge.wordpress.com/2010/04/27/texas-memory-systems-ramsan-620/

Looks like the clouds silver lining might just be SSDs.

Wednesday, June 2, 2010

Calculating a True Storage Value Index

By Mike Ault, Oracle Guru, TMS, Inc.

I read with interest a new paper from Xiotech that puts forward a new performance metric called the “Storage Value Index”. The Storage Value Index takes into consideration several key characteristics of an IO subsystem to give an overall numerical grade to determine the true value of your, or a proposed, IO subsystem. The basic formula for the Value Index is:

Storage Value Index = (TUC*IOPS*WY)/cost

Where:
TUC=Total usable capacity in Terabytes
IOPS=validated IOs per second (SPC-1 results for example)
WY=Warranty years (or years of paid maintenance if added to cost)
Cost=Cost of validated system

I found this to be an interesting metric except for one problem: it is only taking into consideration one side of the performance issue, IOPS. Why do I say this? Let’s look at some results from applying this metric to see where there may be issues with this value. Look at table 1 which uses values from the SPC website for its data source.


Table 1: Calculated Storage Value Indexes

From consideration of Storage Value Index (SVI) alone we would conclude from the results in Table 1 that the Fujitsu DX8400 would be the best IO subsystem because of its SVI of 35.4, followed by the Infortrend at 28.7 and so on. However this SVI is not giving us the entire performance picture. Notice that the systems with the lowest latency are being penalized by the ability of higher latency systems to add disks to increase IOPS.

In my work with Oracle tuning both prior to and during my tenure with Texas Memory Systems, my primary indication of IO subsystem problems is the read latency. Generally speaking the higher the IO latency the worse the system will perform. If you notice, the SVI doesn’t include anything dealing with latency. From queuing theory we know that IOPS and latency are not dependent on each other. To increase IOPS we can just add queues. I can have hundreds of thousands of IOPS and still have latencies in the 10-20 millisecond range just by adding disk drives to a system. So, it should be obvious if we want to take into consideration the true value if a system we must take into account the latency of that system at the measured IOPS value used in the SVI calculation. To this end I propose the latency adjusted SVI is a better measure as follows:

Adjusted Storage Value Index = (TUC*IOPS*WY)/(cost*L)

Where:
TUC=Total usable capacity in Terabytes
IOPS=validated IOs per second (SPC-1 results for example)
WY=Warranty years (or years of paid maintenance if added to cost)
Cost=Cost of validated system
L=Latency at measure IOPS level

Taking into account the latency now makes our results adjusted by both the throughput (IOPS) and the response time (latency) and gives a true Storage Value Index. Table 2 shows the results with this adjustment.


Table 2: Adjusted Storage Value Index

As you can see, by taking into account the final performance metric, latency, the results now give a better understanding of the complete IO subsystem.

In addition, the actual projected operating costs (floor space, electricity and cooling) for the warranty period should be added to the cost figures to get the true monetary cost of the systems to be compared. Unfortunately that information is not provided or easily obtainable.
References:
Xiotech White Paper: “Strategies for Measuring and Optimizing the Value of Your Storage Investments”, May, 2010

http://www.storageperformance.org/results/benchmark_results_spc1/#spc1